The reintroduction of aggressive tariff policies under President Trump has sent shockwaves through global markets—especially in foreign exchange. As trade tensions escalate, currency markets have responded with sharp moves, reflecting shifting investor sentiment, inflation fears, and a reassessment of global economic ties.
In this article, we break down how the world’s top currencies have been impacted, from safe havens like the Swiss franc to commodity-linked currencies like the Aussie and loonie.
Key Points
- Trump’s renewed tariff policies have been linked to increased volatility across major currency pairs.
- Safe-haven currencies like the Swiss franc and Japanese yen have gained on rising global uncertainty.
- Commodity-linked currencies such as AUD and NZD have underperformed due to weaker global trade outlooks.
Currency 1: USD Index
The dollar is the world’s reserve currency, one which has been backed by having the largest economy and allowed it to play the number one role in global markets. Numerous countries actually peg their currencies against the dollar, while a huge amount of currency transactions every day involve the USD. Commodities like gold and crude oil are also denominated in dollars. The Dollar Index comprises six of the US main trading partners, with the euro, yen and British pound making up roughly 58%, 14% and 12% of the index respectively.
How was it affected by the Tariff?
The dollar has suffered as both the Trump trade and US exceptionalism have withered. Protectionist sentiment may have contributed to investor caution toward the greenback, as they look to alternatives and safe havens due to the uncertainty of trade policy and ongoing trade war. Some analysts have suggested that ongoing trade tensions may erode confidence in the dollar, although outcomes remain uncertain as markets shift away from US assets, both in equities and Treasuries. The combined threat of inflation and growth deceleration has hurt the greenback, even if the end of its haven status is still to be decided.
Technical Analysis
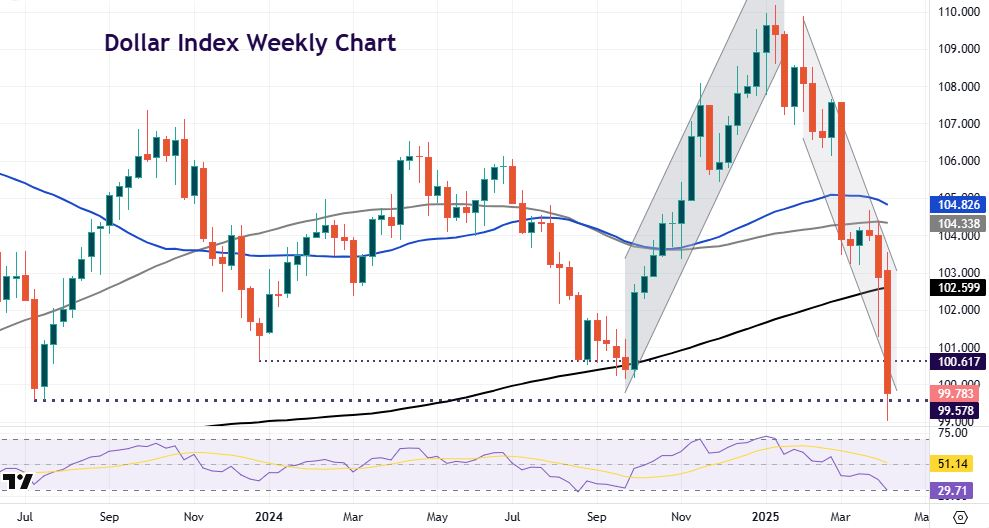
Ahead of last November’s US election and into the new year, the dollar appreciated sharply in anticipation of Trump policies like tariffs, tax cuts and deregulation, and US exceptionalism continuing. But prices turned around in January and sunk.
After the very strong near-term selling in the USD, we have selected a weekly dollar index chart to show some long-term support levels. The July 2023 low at 99.57 got pierced but prices closed on the week recently just above this key mark. Other important areas include the December 2023 bottom at 100.61 and the September 2024 trough at 100.15.
Currency 2: EUR/USD
EUR/USD is the world’s most popular currency pair, with daily volumes topping all other currency majors. The euro is the currency of most of the EU, a group of 27 member states which started from just six neighbouring states in 1951.
Among these, 20 countries adopted the euro as their common currency, while they also share the same monetary policy set by the European Central Bank (ECB). The EUR/USD market is sometimes referred to as a ‘washing machine’ by economists, where global trade and portfolio flows meet and cancel each other out.
How was it affected by the Tariff?
EUR/USD has inevitably been volatile amid all the tariff on-off news and headlines. It has been broadly bid with the loss of confidence in the dollar and the “Sell America” theme benefitting euro asset markets. Indeed, if this were to play out more extensively, the single currency would be one of the few available to absorb any exodus from US assets. A modestly better outlook for world trade should further help the euro, while it seems the EU isn’t willing to escalate its trade war with the US for now.
Technical Analysis
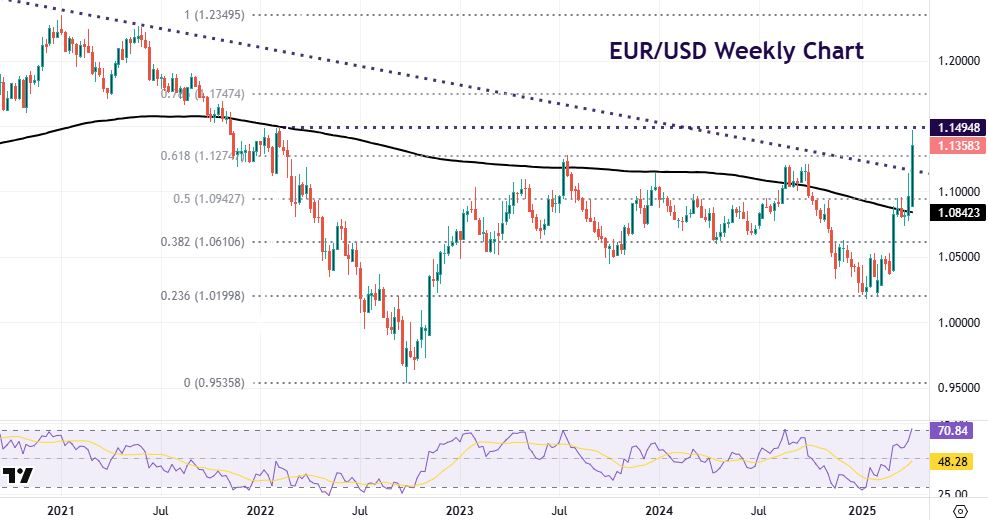
The weekly EUR/USD chart shows that the strong bullish rally has broken a long-term down trendline from the 2008 highs. Prices are also just above a major Fibonacci retracement level (61.8%) of the January 2021 high to September 2022 low at 1.1274. Bullish momentum is obviously strong, if a little overbought on some momentum indicators.
Currency 3: USD/JPY
After the USD and the EUR, the yen is the most heavily traded currency, with USD/JPY also ranking as the second most traded currency pair. Due to the role that Japan plays in international trade and Tokyo as a major financial centre, there is a need for the JPY in order to complete international transactions. The yen also has the lowest interest rate among the majors, so it has been used as a funding source in carry trades.
How was it affected by the Tariff?
The yen acts primarily as a safe haven currency. That means it is in high demand during times of uncertainty and financial market stress. In the current environment and with the dollar’s recent downturn, it may reflect investors’ search for safety.
That has seen the major fall quite sharply with tariffs imposed on Japan overlooked, for the time being. Any rotation away from defensive currencies has seen the yen sell off, with the Treasury markets also directing price action too.
Technical Analysis
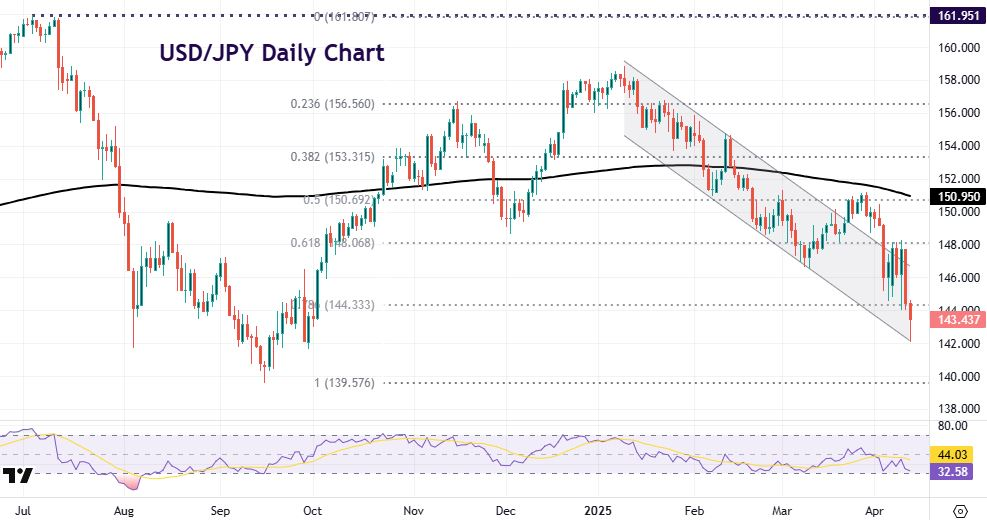
USD/JPY remains in the bear channel after posting highs close to 159 in early January. Prices actually briefly broke to the upside of the channel in late March, but prices were capped by a retracement level at 150.69.
A minor Fibonacci level (78.6%) of the July 2024 to September 2024 move is 144.33. A major long-term low sits at 139.57 from September 2024.
Currency 4: GBP/USD
The pound, or sterling or GBP is a highly active currency with GBP/USD, or cable, being the third most active pair and accounting for roughly 14% of daily global trades. Sterling is known to have volatile moves, compared to that of the EUR, because of its marginally lower levels of liquidity. That means GBP pairs may tend to react more strongly to surprise economic data releases.
How was it affected by the Tariff
GBP has underperformed some of its major peers for a few reasons. The euro has better liquidity than sterling and has benefited more as investors leave the dollar. Another explanation is that the looming global trade war is proving the greater leveller for interest rate differentials.
The ‘exceptionalism’ of high UK interest rates is being unwound and could be a dominant theme in the near term. But expectations of less BoE easing have also supported the pound, along with a lower level of tariffs compared to some countries.
Technical Analysis
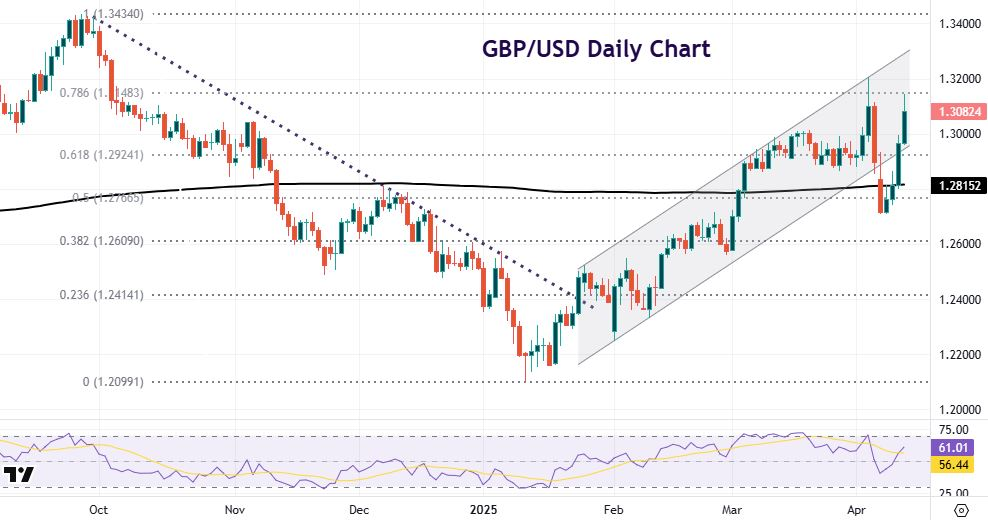
GBP/USD remains in an ascending bull channel after briefly dipping out earlier in April. Prices were supported by the 200-day simple moving average at 1.2815 and the midpoint of the September 2024 to 2025 low at 1.2766.
Key technical resistance levels observed include 1.3148 and the year-to-date high at 1.3207, which traders may monitor for potential price reactions. The major Fib level (61.8%) of the autumn downtrend sits at 1.2924.
Currency 5: AUD/USD
The “aussie” is heavily tied to the global economy due to Australia having a very robust export industry dependent on its commodities. In turn, AUD is often seen as a “proxy” for the performance of the Chinese economy and is deemed as a “risk-on” or cyclical currency.
When the global economy is growing, Historically, the AUD tends to strengthen in periods of global growth, while economic uncertainty has often coincided with weaker performance. Australia enjoys higher interest rates compared to other major economies. It has also been notoriously famous for consistently having a high current account deficit.
How was it affected by the Tariff
The Australian dollar has underperformed among majors against the US dollar in April. Global growth forecasts have been cut, and China is at the forefront of the trade war – not a good environment for AUD. In fact, the World Trade Organisation now sees the risk of world trade volumes falling 1% this year.
Technical Analysis
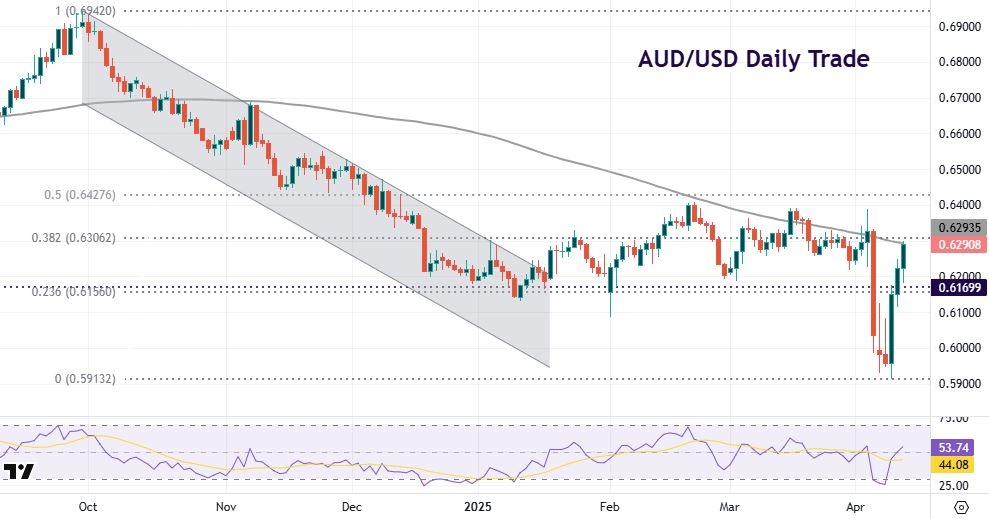
The major was tracking sideways around 0.63 before it plunged on 4 April as it made a fresh year-to-date low and broke down through a previous long-term low from October 2022 at 0.6169.
But after hitting 0.5913, prices have recently risen sharply as the significant volatility in the USD has developed. The 100-day simple moving average sits at 0.6293 with a major retracement level at 0.6306.
Currency 6: NZD/USD
NZD is often known as the “kiwi” and is also heavily linked to the global economy and commodity prices. New Zealand’s economy is strongly export orientated and dependent on agricultural commodities. If those prices rise, then the amount of money paid for New Zealand’s exports also rises, which then makes a larger contribution to the country’s GDP, potentially leading to kiwi appreciation. It also means NZD is often seen as a “risk-on” or cyclical currency.
How was it affected by the Tariff
The NZD has outperformed its closest peer, the aussie, but underperformed the other major commodity currency, CAD. Similar to AUD, the global growth outlook is growing weaker by the day as tariffs and policy uncertainty see investment and business decisions being hugely negatively impacted. Even though its own tariffs have been reduced, the US-China trade war will dominate.
Technical Analysis
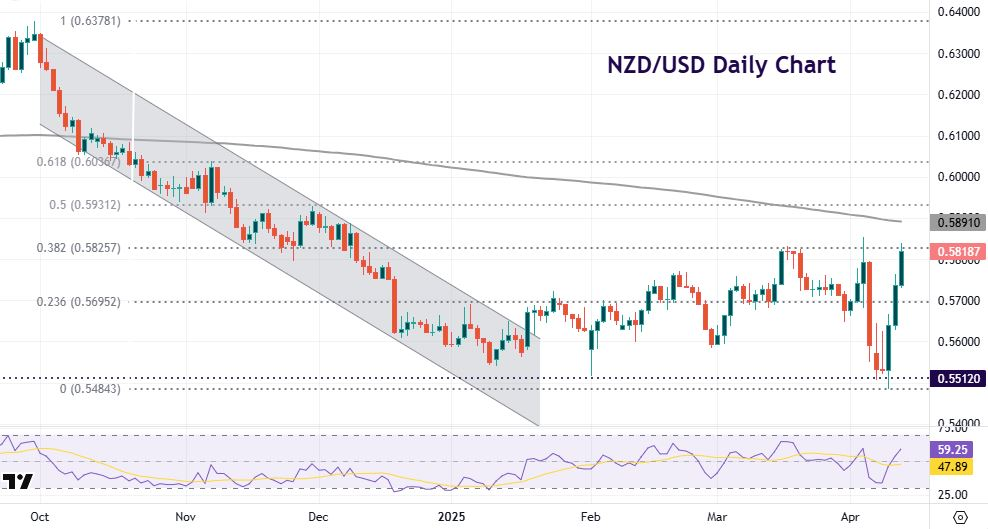
Inevitably, price action in the Kiwi has been very similar to the Aussie. A long-term bear channel slowed in January as the pair tracked around 0.57 for a few months.
Prices then made fresh lows for 205 very recently at 0.5484 but have bounced off this level, which tallies with a long-term bottom from October 2022 just above at 0.5512. Upside levels include 0.5825 and the 200-day simple moving average at 0.5891.
Currency 7: USD/CAD
CAD is often called the “loonie” after Canada’s national bird which is engraved on the country’s coins. Historically, the price of crude oil has been highly correlated with USD/CAD. The general rule is that whenever oil prices start climbing, CAD usually follows.
That means if the price of crude is projected to increase over the next couple of years, then Some traders may view rising oil prices as a supportive factor for CAD, historically associated with downward moves in USD/CAD. CAD has also generally had a high correlation to the S&P 500 stock market so is similar to its other commodity-dollar peers in that it is a ‘risk-on’ currency.
How was it affected by the Tariff
CAD has been mid-pack in the majors in April, outperforming its commodity-dollar peers but underperforming the European safe havens and yen. The loonie initially whipsawed on President Trump’s first tariff announcement regarding Canada and Mexico levies as the major hit multi-decade highs.
But prices quickly reverted back to the recent range when one-month delays were declared. More recently, the CAD been pulled along with the broader sell-off in the USD and notched up another decent weekly gain—its fourth on the trot and the largest since late 2022. US/Canada spreads have compressed somewhat amid all the volatility in markets, but the weak USD tone is the primary driver of the CAD’s rise.
Technical Analysis
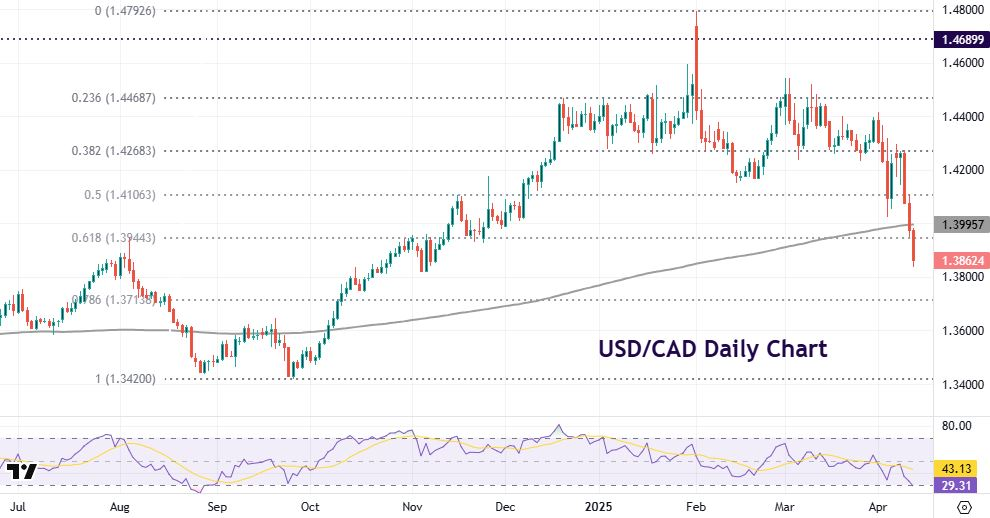
After spiking higher to 1.4792, a level not seen since 2003, the major reverted back to its recent range between 1.4268 and 1.4468, give or take. These are Fib retracement levels of the September to February rally.
But since the recent downturn, USD/CAD has turned lower with prices falling through the 200-day simple moving average at 1.3995 and the major Fib level (61.8%) at 1.3944. The next downside target is 1.3713.
Currency 8: USD/CHF
The Swiss franc is now the only European country using the franc as its currency, after France, Belgium and Luxembourg all adopted the euro. The “swissy” is widely known as a safe haven currency primarily due to Switzerland being politically neutral and having bank secrecy laws. During times of uncertainty, investors move their funds into Switzerland, which causes CHF to gain in value.
How was it affected by the Tariff
The Swiss franc has appreciated over 8.5% versus the dollar in April, the leading major currency by some distance. It enjoyed its biggest one-day rally since 2015 on 10 April, emerging as the preferred recipient of safe-haven flows leaving the dollar. Also important is the contained risk that the Swiss National Bank (SNB) will intervene to prevent excessive CHF strength.
The thinking here is that sustained, one-sided FX intervention would raise alarm bells at the US Treasury, which could then officially label Switzerland an FX manipulator and impose harsher tariffs.
Technical Analysis
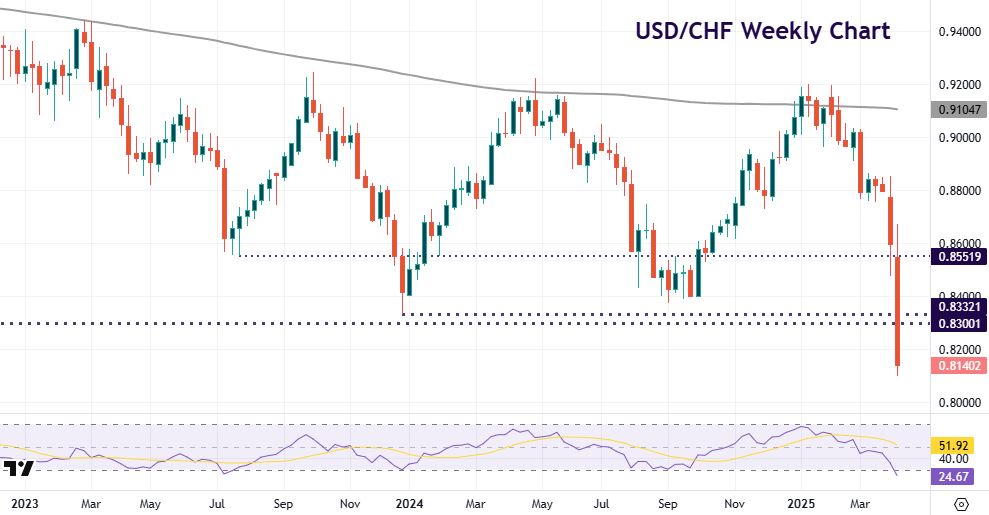
USD/CHF has dropped sharply since “Liberation Day” after trading sideways around 0.88 for most of March. Range trading and contraction for a period of time often means range expansion and a breakout in line with the dominant trend.
Prices moved significantly below the 200-day simple moving average at 0.8787 to a previous swing low a 0.8551, reflecting heightened volatility during this period. Another dramatic move lower saw prices break through key support levels at the December 2023 bottom at 0.8332 and the 2015 low at 0.83. There is a long-term retracement level at 0.7726.
Currency 9: USD/CNY
The yuan is the primary unit of Chinese modern currency or renminbi. The term renminbi is the official name of China’s currency, while yuan refers to the actual units. Although China is reforming its exchange rate policies, the yuan still remains pegged to the US dollar. This means that if the dollar rises or falls in value, the yuan follows accordingly.
One problem with this peg is that it has caused tension between China and the United States, which has come close to naming China a currency manipulator. Because the yuan is undervalued, some claim that it gives China an unfair trade advantage and has been the main driver of Chinese growth.
How was it affected by the Tariff
USD/CNY was drifting higher ahead of “Liberation Day”, before the pair saw whipsaw two-way price action for two days between 7.35 and 7.25. The market was trying to figure out the impact of the ratcheting up in tariffs between the two countries while most other countries tariffs were reduced.
Many economists think after a certain point, further tariffs are meaningless. In any event, the US and China are in a powerplay game of brinkmanship. Until a deal is announced or a big, bilateral meeting confirmed, USD/CNY is now the focal attention of the FX market.
Technical Analysis
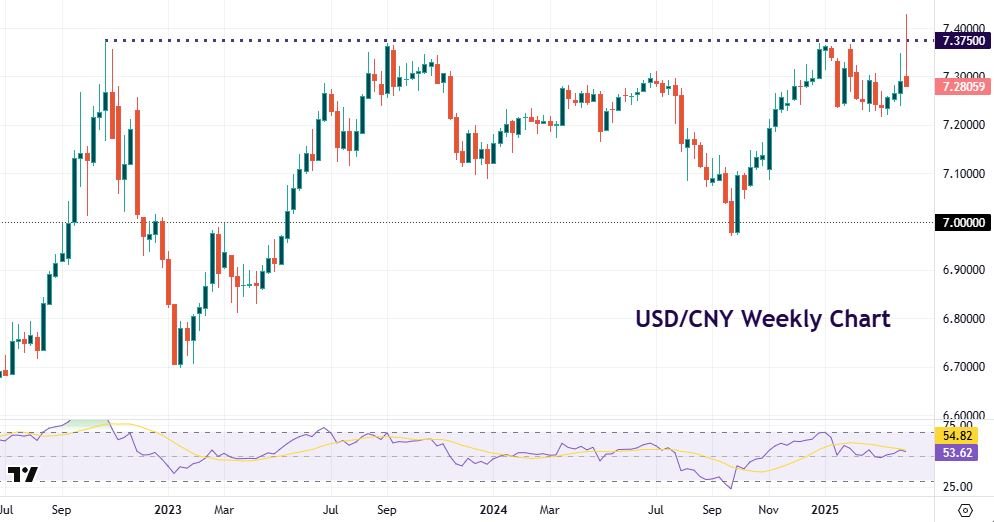
The major saw choppy price action after the first major tariff announcements. USD/CNH then spiked above 7.400, breaking long-term strong resistance around 7.3750, which is a previous zone from various highs going back to October 2022.
Any fixes higher are now considered to reinforce the view that a controlled weakening of the yuan is part of China’s policy response to tariffs. Prices have recently fallen sharply back below 7.300. A near-term retracement Fib level sits at 7.2530.
Currency 10: USD/MXN
The Mexican peso is the currency of Mexico, the other neighbouring country of the US. The symbol MXN replaced the former symbol, MXP. The Mexican peso was the first coin in the world to use the sign “$”, even before the US dollar.
How was it affected by the Tariff
There was a lot of noise initially about tariffs on Mexico and Canada in the run-up to the start of April announcement. The country had been the focus of President Trump’s ire early into the year, but he has since softened his stance as the countries share a free-trade agreement. In addition, Mexican President Claudia Sheinbaum has been actively open to negotiating with her US counterpart. That has tempered volatility in MXN.
Technical Analysis
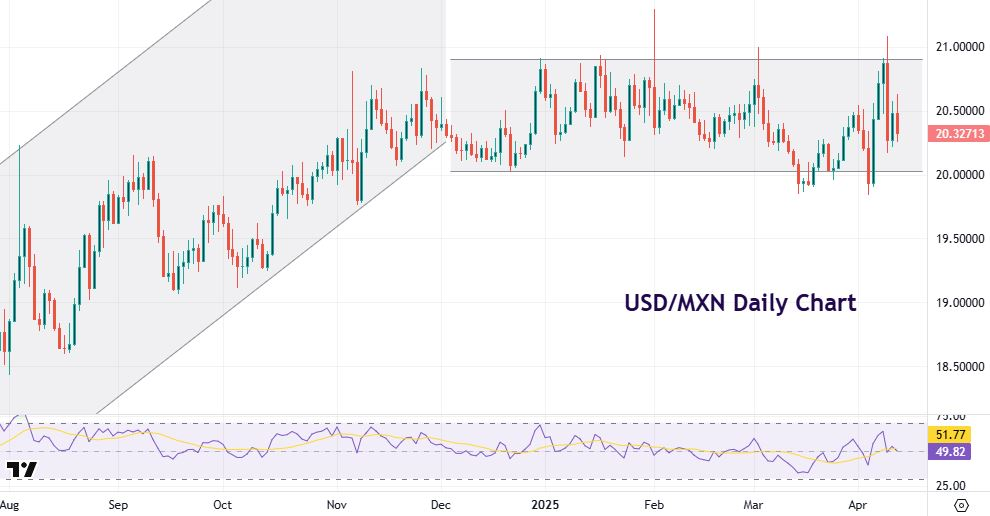
The pair rose from below 16.50 to above 20 from April to November last year. Since then, it has traded in a relatively narrow range between 20 to 21, with spikes and short periods above and below these lower and upper bands. This shows how contained the price action has been during the unprecedented policy making in the White House.
Final Takeaway: Currency Markets Caught in the Crossfire
Trump’s tariff revival has sent ripple effects through global currency markets, with each major reacting based on its economic ties, trade dependencies, and safe-haven status. From the dollar’s waning dominance to the surge in the Swiss franc and volatility in commodity currencies, traders must now navigate a more fragmented and politically charged forex landscape.
As uncertainty lingers, staying informed and agile will be key to managing currency exposure. Open a live account with Vantage today and explore potential opportunities presented by market volatility.